Best press release distribution
2020’s been wild, and it’s even more wild to see a retrospective of its most popular searches
Now, a couple of things to note before we dive into the meat of things. Even though these are global trends, many of them pertain mostly to the US and to some extent India, as it’s all based and filtered out by top search results.
Also, when this graph first popped up on Reddit, the commenters noted that the data relates to itself, but it is definitely based on absolute numbers—just that Google itself doesn’t release those numbers.
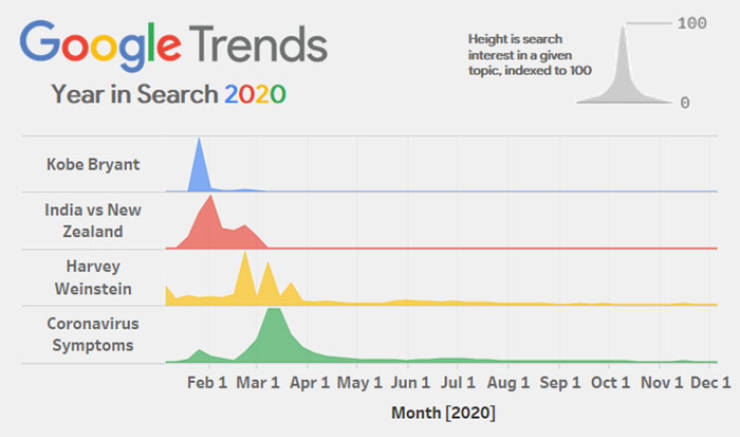
“So, basically, when Google released their Year in Search list, all the data was publicly available for download from their lists. It provides the top 10 search terms generally, regardless of category. Then it also has the top 10 terms for categories such as news, people, actors, TV shows, concerts etc,” elaborated Khan. I wanted this visualization (viz) to not only reflect the top terms but also represent what the year 2020, as in if people were to look back on this viz five years from now, would it capture the events that defined the year?”
He continued: “That was my guiding metric and as such I chose to not only show the top 10 general search terms but also include the top terms for news events and people, because these 3 categories can act as the pulse of culture—and I believe from the massive attention they got, people agreed. Once I got the results, I used Tableau to visualize them all in this Ridgeline plot. I’m a specialist in Tableau so it’s always been my go-to visualization software. A Ridgeline plot is where you have multiple measures that are shown across a similar timeline or distribution.”


firstly it's not news, it's interesting data from google search released by google and used by a redditor. 2nd if you come to izismile for news, while they generally just reposting stuff from reddit and other site, i'm afraid you are in the wrong place.

firstly it's not news, it's interesting data from google search released by google and used by a redditor. 2nd if you come to izismile for news, while they generally just reposting stuff from reddit and other site, i'm afraid you are in the wrong place.