Learn more about US demographics with these eye-opening maps that break down population shifts and racial and political changes throughout the country. One thing is for certain, major population changes are happening in the US.
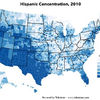
Hispanic concentration:
Black concentration:
Ground Zero, NYC:
The top 10 most segregated cities:
Milwaukee, WI (The most segregated city in the US):
Growth in hispanic population in the past 10 years:
Percent change in population:
Percent change in population vs. National average:
A 3D map of population growth:
The top 10 shrinking cities:
Detroit's population over the years:
The percent change in minority population by county:
Population distribution by county:
The average income per person:
Population change by state:
The black population in major cities:
House Of Represenatives seats lost or gained:
West Virginia population growth:
State population gains and losses of people under 18:
The hardest to count counties:
Number and percent foreign born in the US population:
Black-owned businesses:
The US metro areas with a population greater than one million people in 2010, ranked by percentage change in population:
White population:
The top 5 states with the greatest census participation: